Faster reports? Greater accuracy? Smarter decisions? Automated reporting seems like a no-brainer. Being able to easily connect your data and auto-update everything instantly drastically improves the quality of your reporting while saving time and resources.
However, automated reporting is not quite as simple as pressing a button and waiting for the magic to happen. Time, effort, skill, and investment in the right tools are required to ensure it works as it should. As a result, there are certain scenarios in which setting up automated reporting as a market researcher—or anyone else working with data—will not be worth the time and effort.
This blog is all about helping you determine when it might be time to get started with report automation. It will also explain how implementing automation into your workflow can save you time and effort.
What is automated reporting?
Automated reporting refers to creating reports or templates that can be automatically updated with fresh data. This allows them to be easily edited and reused. This is done by creating a direct link between your source data and your reports—whether they be in PowerPoint or elsewhere—so they can be automatically updated when the data changes.
This means that the time spent creating, formatting, and customizing an individual report can be used for several different reports, saving time and driving efficiencies across the business.
What does it take to automate a report?
As mentioned above, automated reporting requires some setup and manual work. Data must still be captured, stored, normalized, tabulated, analyzed, and visualized before you can generate the templates and automate that report. Each of these steps takes time and money, and in certain cases, they might also involve hiring specialized talent. Ideally, everything should be performed in the same ecosystem (e.g., Displayr) to ensure a smooth process.
Once that foundation is in place, you can begin the process of creating a reusable report template. While automation can save significant time and reduce errors, it’s important to assess when it makes sense to automate a report—before you start, consider whether the benefits outweigh the initial setup investment and whether your reporting needs are stable enough for automation to truly add value.
Ready to automate your reports?
Start a free trial of Displayr.
Best use cases for report automation
1) Longitudinal studies
One of the most common use cases for automated reporting is in longitudinal/tracking studies, such as a customer satisfaction study or brand tracking report. It might be a fast food company examining the popularity of different seasonal food items. Or an employee engagement survey studying company engagement over time. Researchers create these reports based on data collected over an extended period; therefore, they need to be able to update the data quickly and routinely.
By implementing automated reporting into longitudinal studies, you can dramatically reduce the time and effort required to update these reports and focus more resources on finding insights. Rather than having to create a new report each time you need to update the data, you can simply create a template to be used as the foundation for the report moving forward, and constantly update the template with fresh data.
2) Working with legacy studies
It is not uncommon for organizations to use PowerPoint reports – like a brand tracking survey – for years upon years. Once a PowerPoint is ‘part of the furniture,’ there is more likely to be resistance when making significant changes.
Although this is a clear use case for automated reporting (in that there is data that needs to be constantly refreshed) there is the added difficulty of having to stay in line with legacy systems and processes. Displayr makes it easy to update the charts while still retaining the original look and feel. Simply recreate the chart in the Displayr app and then update the existing PowerPoint presentation with the new data.
3) Multiple variations of the same report
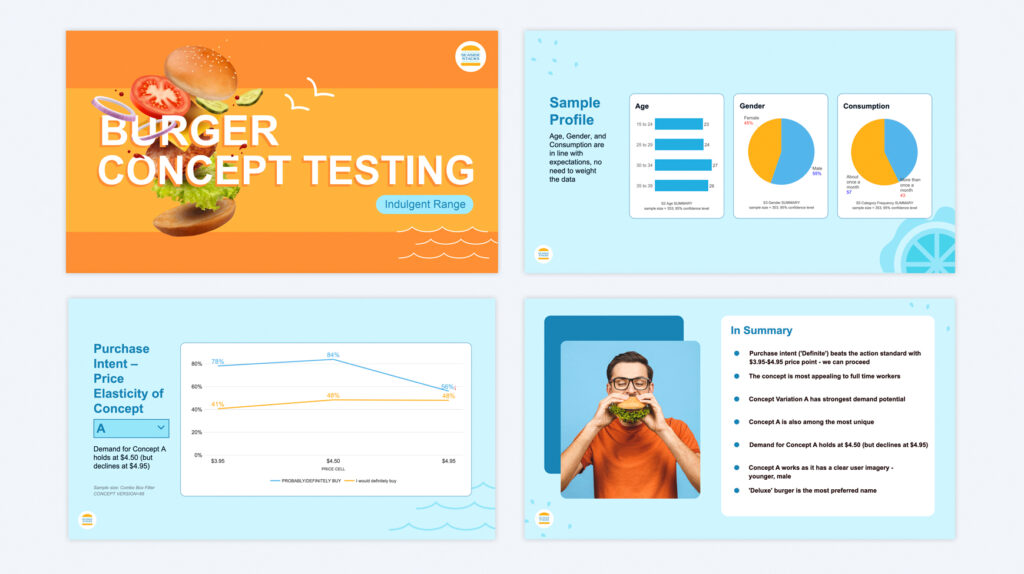
Automated reporting is also a powerful timesaver when you need multiple versions of the same report. A standard example of this is when you are running a new product or service and need to perform a concept test. Concept/product testing involves showing prospective customers a new prototype and asking their thoughts.
Concept tests are typically designed to be highly repeatable so that researchers can easily compare different prototypes and make well-informed decisions. As a result, report automation allows users to create as many different reports as they need with the click of a button. With Displayr, you can also add comments that pipe through to a summary page, sort crosstabs by significance, and easily add filters to make the report more interactive.

4) PowerPoint is holding you back
PowerPoint’s limitations, particularly when it comes to automating updates and integrating dynamic data, can make it difficult for users who need to update charts and presentations regularly (e.g., market researchers!). PowerPoint’s manual process of creating and editing charts, combined with the challenge of maintaining consistency across multiple reports, can be time-consuming and error-prone, especially for recurring tasks like tracking studies.
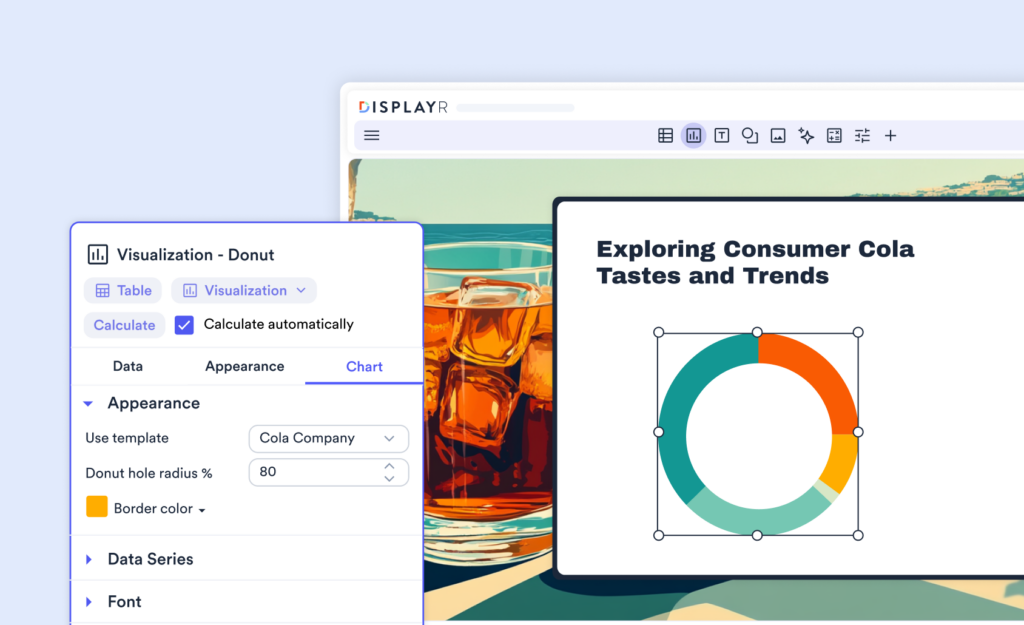
Implementing an automated reporting tool like Displayr allows you to generate and update charts dynamically. Seamlessly export to PowerPoint, and ensure consistency across reports—all while saving valuable time and reducing the risk of mistakes. If you love working in PowerPoint but struggle with creating editable objects, Displayr is a great option. Its familiar interface and utilization of a page master tool (which is very similar to a slide master in PowerPoint) make it a great option.
5) There’s a mistake in your data
Report automation works by creating a direct link between your source data, analysis, and report. This is why it is so easy to change or update the data in the report or templatize the report for use in another study.
Because it is so easy to change a report’s underlying data, report automation is a huge timesaver if a mistake is found after the report has been finalized. Rather than painstakingly going through the report and updating every chart, table, and number, you can simply update the report with new data once the error has been addressed.
6) Authoring new reports
As mentioned, automated reporting is an enormous time saver when it comes to updating already-made reports with fresh data. And the more of your reports you have set up for automation, the easier it’s going to be in the future. That’s why it is so beneficial to go into the process of authoring new reports with a focus on automation.
Finding the right report automation match for your business
Automation is a matter of degree, meaning that as technology advances, automation will be performed to a higher level than it has been before. Therefore, we can expect to see report automation capabilities continue to evolve, moving from human expertise to standardizing processes to templatizing reports and finally moving to full automation.
This isn’t to say that full automation needs to be the next step for every market researcher producing reports. Today, it is common for businesses to implement a mixed evolution model. This involves a human-led strategy powered by standardization and templatization.
But just because something can be automated doesn’t mean it should be. Setting up automated workflows can take hours or even days of effort and can be expensive. If the final result is a timesaving of just a few seconds, it’s likely not worth the effort.
There is also the risk of over-standardizing your reports. By putting too much emphasis on creating reusable and updateable reports, they will inherently lose some of their ‘magic.’ Striking a balance between automation and humanity is the key to ongoing success.
Make your reports work for you
By automating your reporting with Displayr, you can start to make your reports work for you. Create effortlessly on-brand, fully updated, and error-free PowerPoint reports – every time, with a fraction of the effort.
Want to find out more? Try it free today.

