Easily optimize portfolios using TURF

Displayr is the easiest and most efficient TURF tool in the world. It has all the tools needed to do a best-practice TURF in the blink of an eye. And it’s so easy to use that even beginners can do TURF analysis themselves.

displayr-turf-analysis-happy-client
Personality-Traits
TRUSTED BY THOUSANDS OF CUSTOMERS

Maximize market reach with TURF analysis

Turf - Easy to understand, client ready outputs

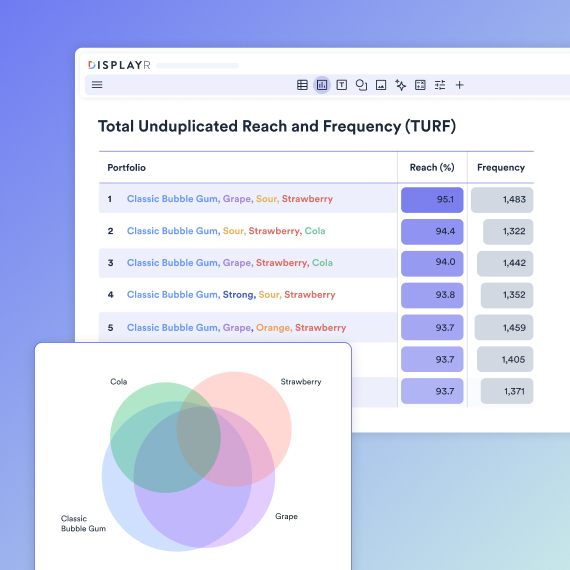
Easy to understand, client ready outputs

Displayr’s TURF basic output is easy to read and directly shows the key conclusions, in a format that you will be happy to share with your stakeholders, as it looks nice and is easy to understand.

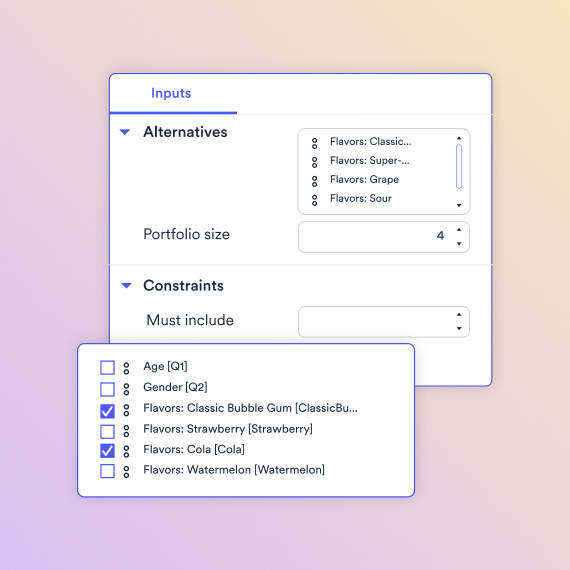
All the advanced options

In addition to doing the standard TURF; you can do all the little tweaks that are required, such as specifying the maximum and minimum portfolio size, number of top portfolios to show, with particular alternatives that must be included in the portfolio, as well as combinations that cannot appear together.
Turf - All the advanced options
Turf - Waterfall visualization

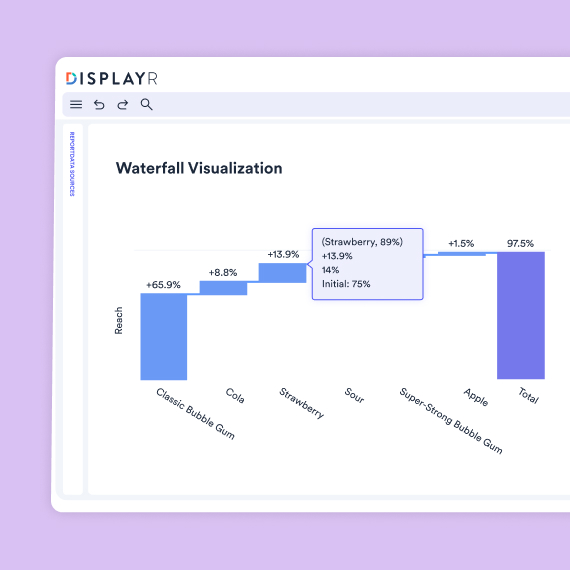
Waterfall visualization

Displayr automatically produces the waterfall visualization, allowing you to understand and communicate the point at which adding new products to the portfolio ceases to make sense.

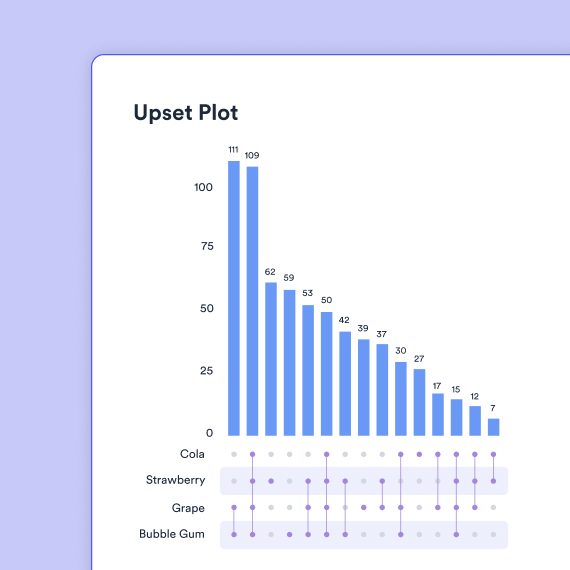
Upset plot for deep dives

The upset plot is a more technical plot, which allows you to drill in and get an understanding of the relative duplication of different combinations of products.
Turf - Upset plot for deep dives
Turf - Fast to use

Fast to use

Even if your data is not in the typical binary format required for TURF, you can get it in the right format with a single button click.

Automatically update analysis and reports

No code needed – just update your analysis by replacing the old data file with the revised one. All steps performed on the previous data set, such as text coding, table modifications, labelling, constructing variables, creating tables, charts, analyses, etc. will be automatically redone using the new data.
PowerPoint presentations, online reports, excel workbooks, and dashboards are automatically updated with each new wave of data. Done!

Displayr-Automated-Reporting-Data-Refresh
It’s analysis, business intelligence, and data science made in one package, for research. When I started exploring Displayr, I fell in love. I couldn’t go back.
Wang Wang
Wang Wang

Research Analyst, dunnhumby

10x faster TURF analysis

Illustration for displayr all types of data

All types of data

SQL, databases, Excel, CSV, text, SPSS, survey platforms, APIs, integrations, & more.

Displayr support all types of analysis

All types of analysis

Summary tables, crosstabs, pivot tables, regression, text analysis, segmentation, machine learning, & more.

Illustration for displayr all types of reporting

All types of reporting

Data visualization, interactive data apps, dashboards, presentations, PowerPoint, Excel, PDF, web pages, & more.

One complete platform to do it all

Automatic theme detection

AI automatically identifies and categorizes themes within your text data, providing deeper insights.

Emotion detection

Understand and analyze complex emotions like frustration and sadness, helping you understand customer motives.

Entity extraction

Extract key entities like names, places, and organizations to enrich your analysis.

Customizable categories

Fine-tune and adjust categories to match your specific needs and preferences.

Text visualization

Create stunning word clouds, charts, and dashboards that help tell the story behind your text.

Global language support ​

Analyze text data in any language, with true native language support to a global audience.

Sentiment analysis

Analyze large volumes of text to gauge positive, negative, or neutral sentiments.

Natural Language Processing

Extract insights with unrivalled accuracy, utilizing NLP to reduce manual effort and free up time.

Case Study - VENNLI

Global Market Research Company ​

Displayr helps Vennli complete projects 5x faster

Challenges

  • Moving away from Excel’s manual processes
  • Finding a flexible tool for advanced analysis and data visualization

Solutions

  • A dashboard tool with interactive visualizations
  • R integration with a user-friendly interface

Results

  • 5x faster than before
  • Ability for their clients to explore the data themselves

“I would recommend Displayr in a heartbeat. It does all of your analysis, visualizations, and reporting in one place.”
Erik Larsen
Erik Larsen
Director of Insights & Analytics, Vennli

See why people love Displayr

TURF FAQs

What is TURF analysis?
TURF stands for ‘Total Unduplicated Reach and Frequency’. It is a market research technique widely used to highlight potential new products or advertising networks that will maximize a company’s reach within a target audience.
The goal of TURF analysis is to determine how to ensure that something appeals to the largest number of unique visitors. A TURF study does this by examining the reach of all possible combinations of products or features while avoiding overlap in customer preferences. Analyzing unduplicated reach identifies the optimal portfolio that appeals to the most unique customers.
An example is determining the best combination of bubble gum flavors for a brand’s product line. TURF analysis can identify the top flavors that together maximize unique customer reach, while minimizing duplication in preferences.
Yes, TURF analysis and MaxDiff are different. TURF analysis focuses on finding the optimal combination of options to maximize reach, while MaxDiff measures the relative importance or preference of individual options. That said, MaxDiff data can be used in TURF, provided it has been converted into a binary format.
Yes, it is possible to perform TURF analysis in Excel:
  1. Collect data showing customer preferences for various options.
  2. Create a matrix where rows represent customers and columns represent their preferences.
  3. Use formulas or a VBA script to calculate total unduplicated reach for different combinations of options.
  4. Compare combinations to identify the optimal portfolio.
However, using Excel for TURF invites an extra layer of complexity when compared to using a specialized tool like Displayr.

Your Displayr deep dive starts here

Join the future of data storytelling

I'm Online

Got 5 mins? I'm online if you want a quick Displayr demo

close-link