
Using Displayr.
If you need to restrict access to individual pages within a document, so that different groups of people see different pages when they log in…
Continue reading
If you don’t need to control access to individual pages within your document, but just need to control access to each document, please read How to Control…
Continue reading
It's super easy to use iframe codes to embded a video into your Displayr dashboard. This'll help you take it to the next level!
Continue reading
There are numerous reasons why you might want to customize your colors. Perhaps you need to conform to design, brand or client guidelines. Perhaps you just…
Continue reading
Each user in your account is a member of one or more user groups. Each document you create has settings which determine which users can…
Continue reading
Feature engineering refers to the process of manipulating predictor variables (features) with the goal of improving a predictive model.
Continue reading
Jaccard coefficients, also know as Jaccard indexes or Jaccard similarities, are measures of the similarity or overlap between a pair of binary variables. In Displayr,…
Continue reading

SurveyMonkey is the world’s largest online survey tool. They help millions of users create and publish online surveys in minutes. While creating and sharing surveys…
Continue reading

Geocoding is the process of translating an IP address to a physical location. In this post I describe how to geocode IPs in Displayr.
Continue reading
Filtering data is an important step when you want to use a subset of your data for analysis. Sometimes this is called drilling-down. Find out how to do it.
Continue reading
People who are serious about understanding the data that you are presenting will want to know your sample size. Learn how to add this to your dashboards.
Continue reading

A correlation matrix is a table of correlation coefficients for a set of variables. I'll show you two easy ways to create a correlation matrix in Displayr.
Continue reading
Sometimes it can be more useful to calculate the average value of categorical data rather than using percentages. Find out how.
Continue reading

Top 2 Box Scores are a tidy way of representing favorable responses to scaled questions in market research. I'll show you how to create one in Displayr.
Continue reading
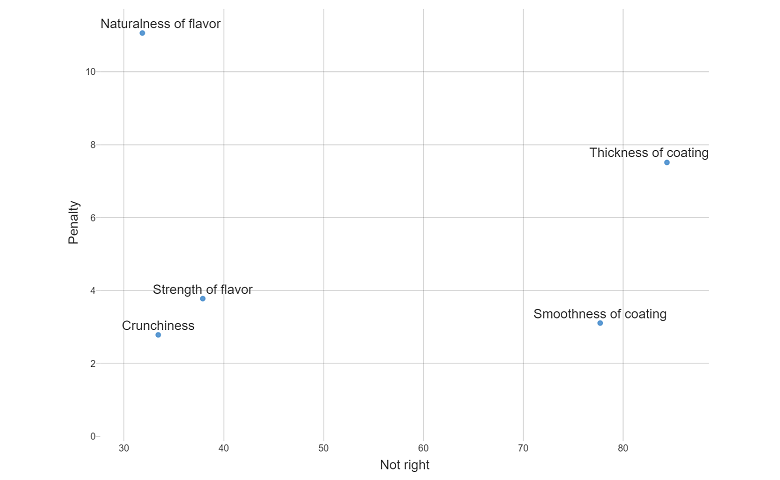
Get the jump on your colleagues by learning how to calculate penalty analysis. I'll explain how to calculate it in Displayr.
Continue reading

We show you how you can create text and icons using code. This allows you to automatically update online dashboards based on data.
Continue reading

There are three methods for uploading and reading Excel files into Displayr. In this post, I'll show you how to easily upload your data to Displayr.
Continue reading
You can easily extract data from Salesforce.com using Salesforce.com API's. The API brings the Salesforce data into Displayr which can be then be analyzed.
Continue reading
This is the third in a series of blog posts designed as a DIY training course for using Displayr. This post illustrates how to pull…
Continue reading
In addition to the content and formatting that you use when creating a Displayr document, you can also: Customize the overall look of the off-page…
Continue reading
Learn how to create a simple dashboard in minutes with any type of data. Includes step-by-step instructions on how to create filters and real-time updates.
Continue reading
Four easy steps to running a Linear Discriminant Analysis in Displayr including a test-train split and using a prediction accuracy table to assess the model
Continue reading
This post provides examples of different types of Dashboards created in Displayr. For each dashboard you can both view the dashboard in View mode (the…
Continue reading
This post shows how to automatically update dashboards and data in Displayr and how to schedule calculations to occur automatically.
Continue reading
It is super-simple to create a table involving one variable in Displayr: just drag it from Data Sets (bottom-left) of the screen onto a page,…
Continue reading
It will not be immediately obvious, but Excel is a key inspiration for the design of Displayr. However, when you jump into Displayr you will be…
Continue reading

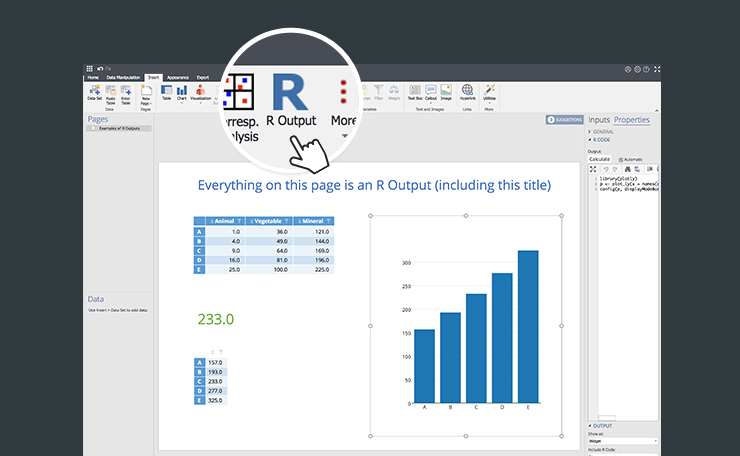
Most data scientists have pretty clear picture of how variables should be created – and it almost certainly involves writing code. While you can take this approach in Displayr,…
Continue reading
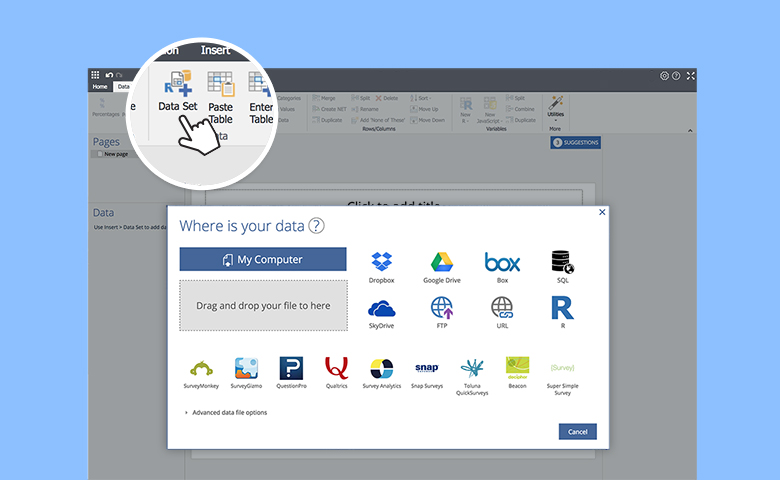
There are lots of ways to get your data into Displayr. They range from cutting and pasting, through to writing advanced data queries in SQL and…
Continue reading

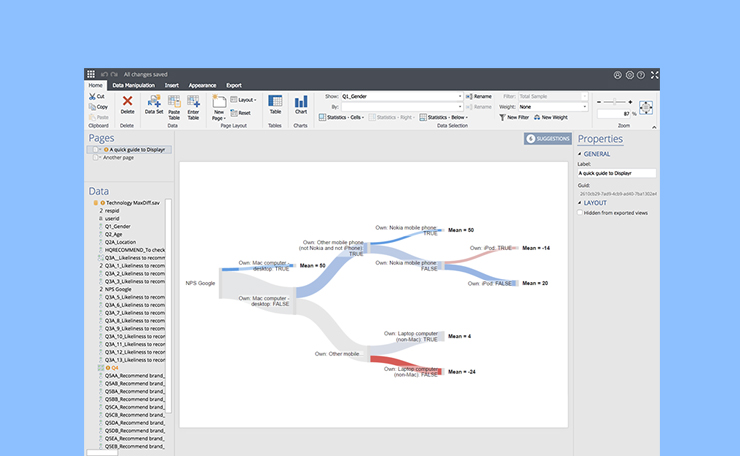
One of Displayr’s unique strengths is the creation and presentation of tables, charts, and other visualizations. This post give a quick overview of the different…
Continue reading
Once you have your data in Displayr, and have created some tables, the next step is to perform calculations using these tables as inputs. The…
Continue reading
This post gives a brief overview of how the more advanced data science analysis methods work in Displayr. Which advanced data science methods are…
Continue reading
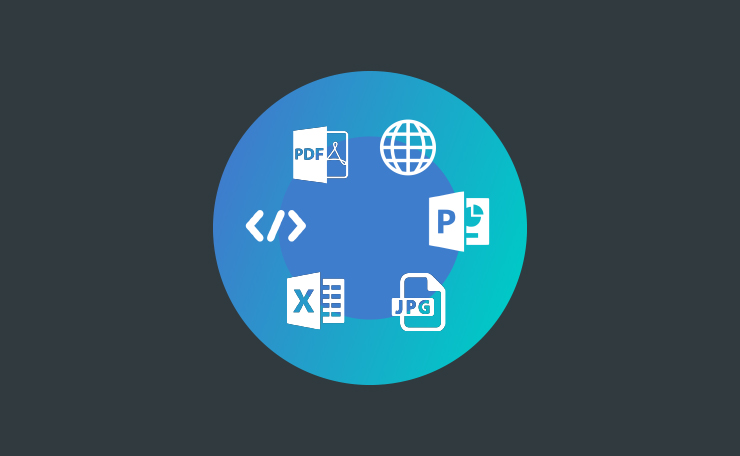
This is the final blog post in our series introducing Displayr’s functionality. It focuses on reporting. Creating a report by exporting the document A Displayr document…
Continue reading

Displayr has lots of tools designed to simplify data analysis. At the core of these tools is the concept of a variable set. The idea of…
Continue reading