
Pictograph.
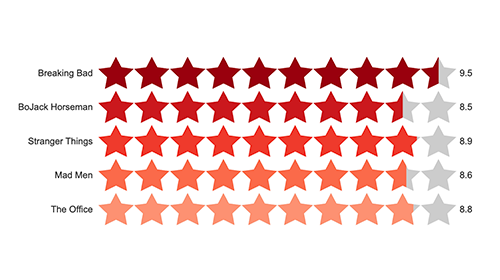
A pictograph bar chart uses multiple icons to show the represent the values in each bar. Make your data more visually interesting with pictographs!
Continue reading

Learn about Net Promoter Score (NPS) and how it evaluate customer loyalty. Gain insights into analyzing NPS data for actionable results.
Continue reading
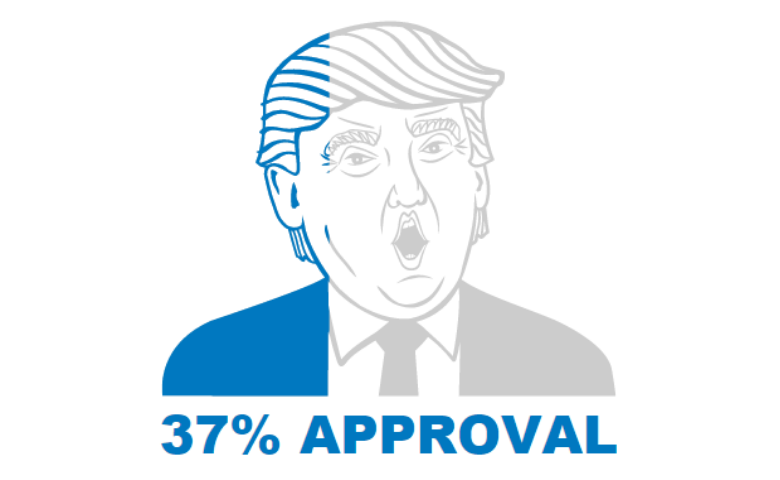
Single icon pictographs can be used to visualize or highlight percentages or proportions in infographics, dashboards or reports.
Continue reading
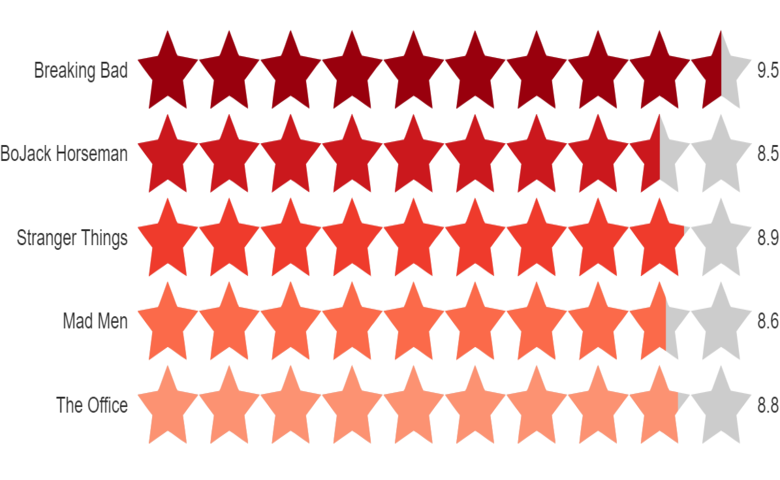
Numbers or counts can be visualized using a multiple number of icons to give impact to these values in infographics, dashboards or reports.
Continue reading

Already read our article on the plastic bag ban and wondered how we made our custom pictographs? We show you how to do it yourself in Displayr!
Continue reading

Read our article on Who is the Booziest Country in the World and want to create your own pictographs and interactive geographical map? We've got you!
Continue reading

Pictographs are exceptionally good for displaying proportional data because they have an intrinsic scale and show quantities visually.
Continue reading
Pictographs are often ridiculed, but their bad reputation is not deserved. There are situations where pictographs are better than bar charts.
Continue reading