
crosstab analysis.

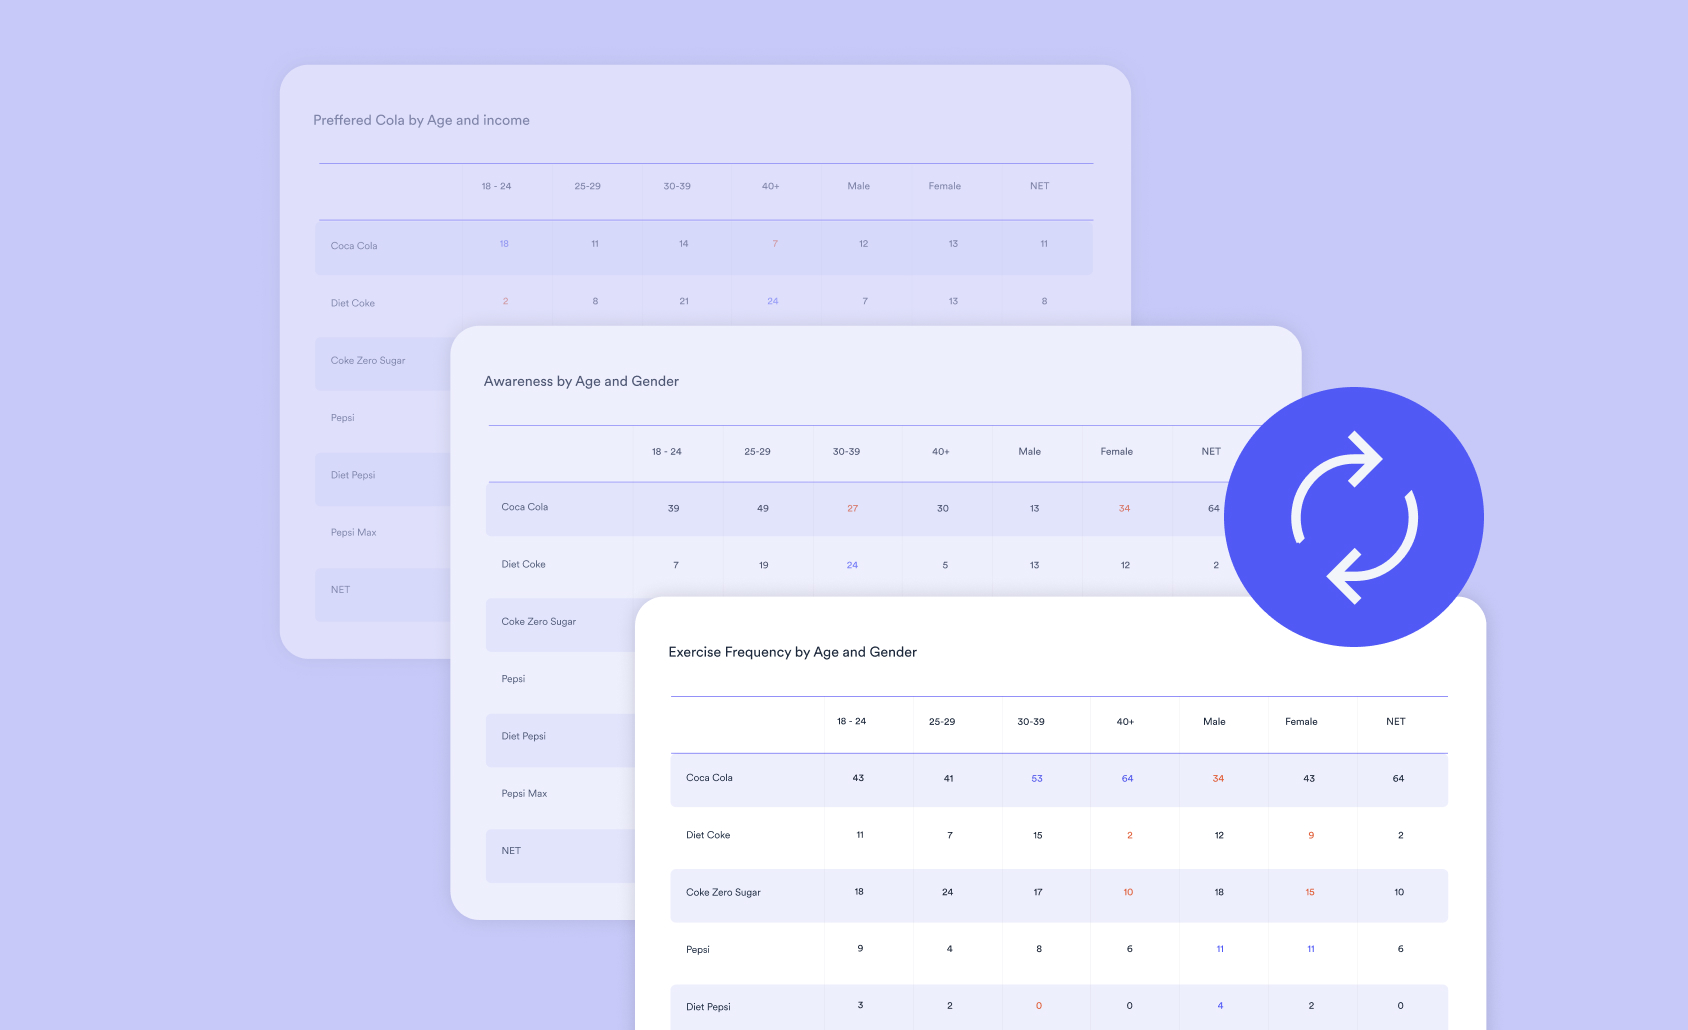
A crosstab is table showing the relationship between two or more variables. Crosstabs are useful for finding patterns and correlations in data. Learn more.
Continue reading

Crosstabulation can save time in survey analysis. Gain a deeper understanding of customer and employee satisfaction to drive business growth.
Continue reading
Learn about crosstabulation to uncover relationships in your data, spot trends, and turn insights into action.
Continue reading

Explore the differences between crosstabs and pivot tables. Find out they can enhance your data analysis and provide valuable insights.
Continue reading

Unlock valuable insights from your survey data with crosstab software. Simplify crosstab analysis with the right tool for your business.
Continue reading
Unlock valuable insights with crosstab analysis. Learn how to effectively compare variables and report results in this comprehensive guide.
Continue reading