Survey and Questionnaire Data Analysis
Don't feel overwhelmed when analysing your survey and questionnaire data. Displayr is a survey analysis and reporting tool that makes it fast and easy. In fact, Displayr will halve survey and questionnaire data analysis times. Schedule a personalized demo and discover how.

Why choose Displayr for the analysis of your questionnaire and survey data?
Displayr's built for survey data. It automates all your grunt work, from cleaning and formatting data to statistical testing. It also guides you through complex analysis procedures with smart systems and machine learning tools. All in a drag and drop, easy to use, online tool.
You can analyze any type of data from SPSS to SQL, import data using APIs, data files, URLs, Dropbox, or type your numbers in. Displayr will format your data into tables, grids, and lists and apply statistical significance for you.
If you are analysing tracking questionnaires or longitudinal data, you can automatically update analysis and reports with new data. It takes one click and everything's updated.
Do you ever have text to analyze? If so, Displayr has state-of-the-art machine learning tools that make it easy to rapidly categorize large amounts of text, very accurately. Giving you infinitely more useful findings then sentiment analysis, but without the pain of manual coding.
If it’s crosstabs you want, rather than read through hundreds of crosstabs, get Displayr to find the most interesting ones for you. This means you can focus on the tables that contain significant results, saving you hours. No more sifting through thousands of numbers!
Displayr is truly collaborative, meaning you can streamline your teams and multiply their output. Have everyone work on the same project, at the same time.
Replace all your analysis and reporting tools with Displayr. Save the time and hassles of moving data between programs. Replace PowerPoint, SPSS, Tableau, R, and Excel with Displayr.
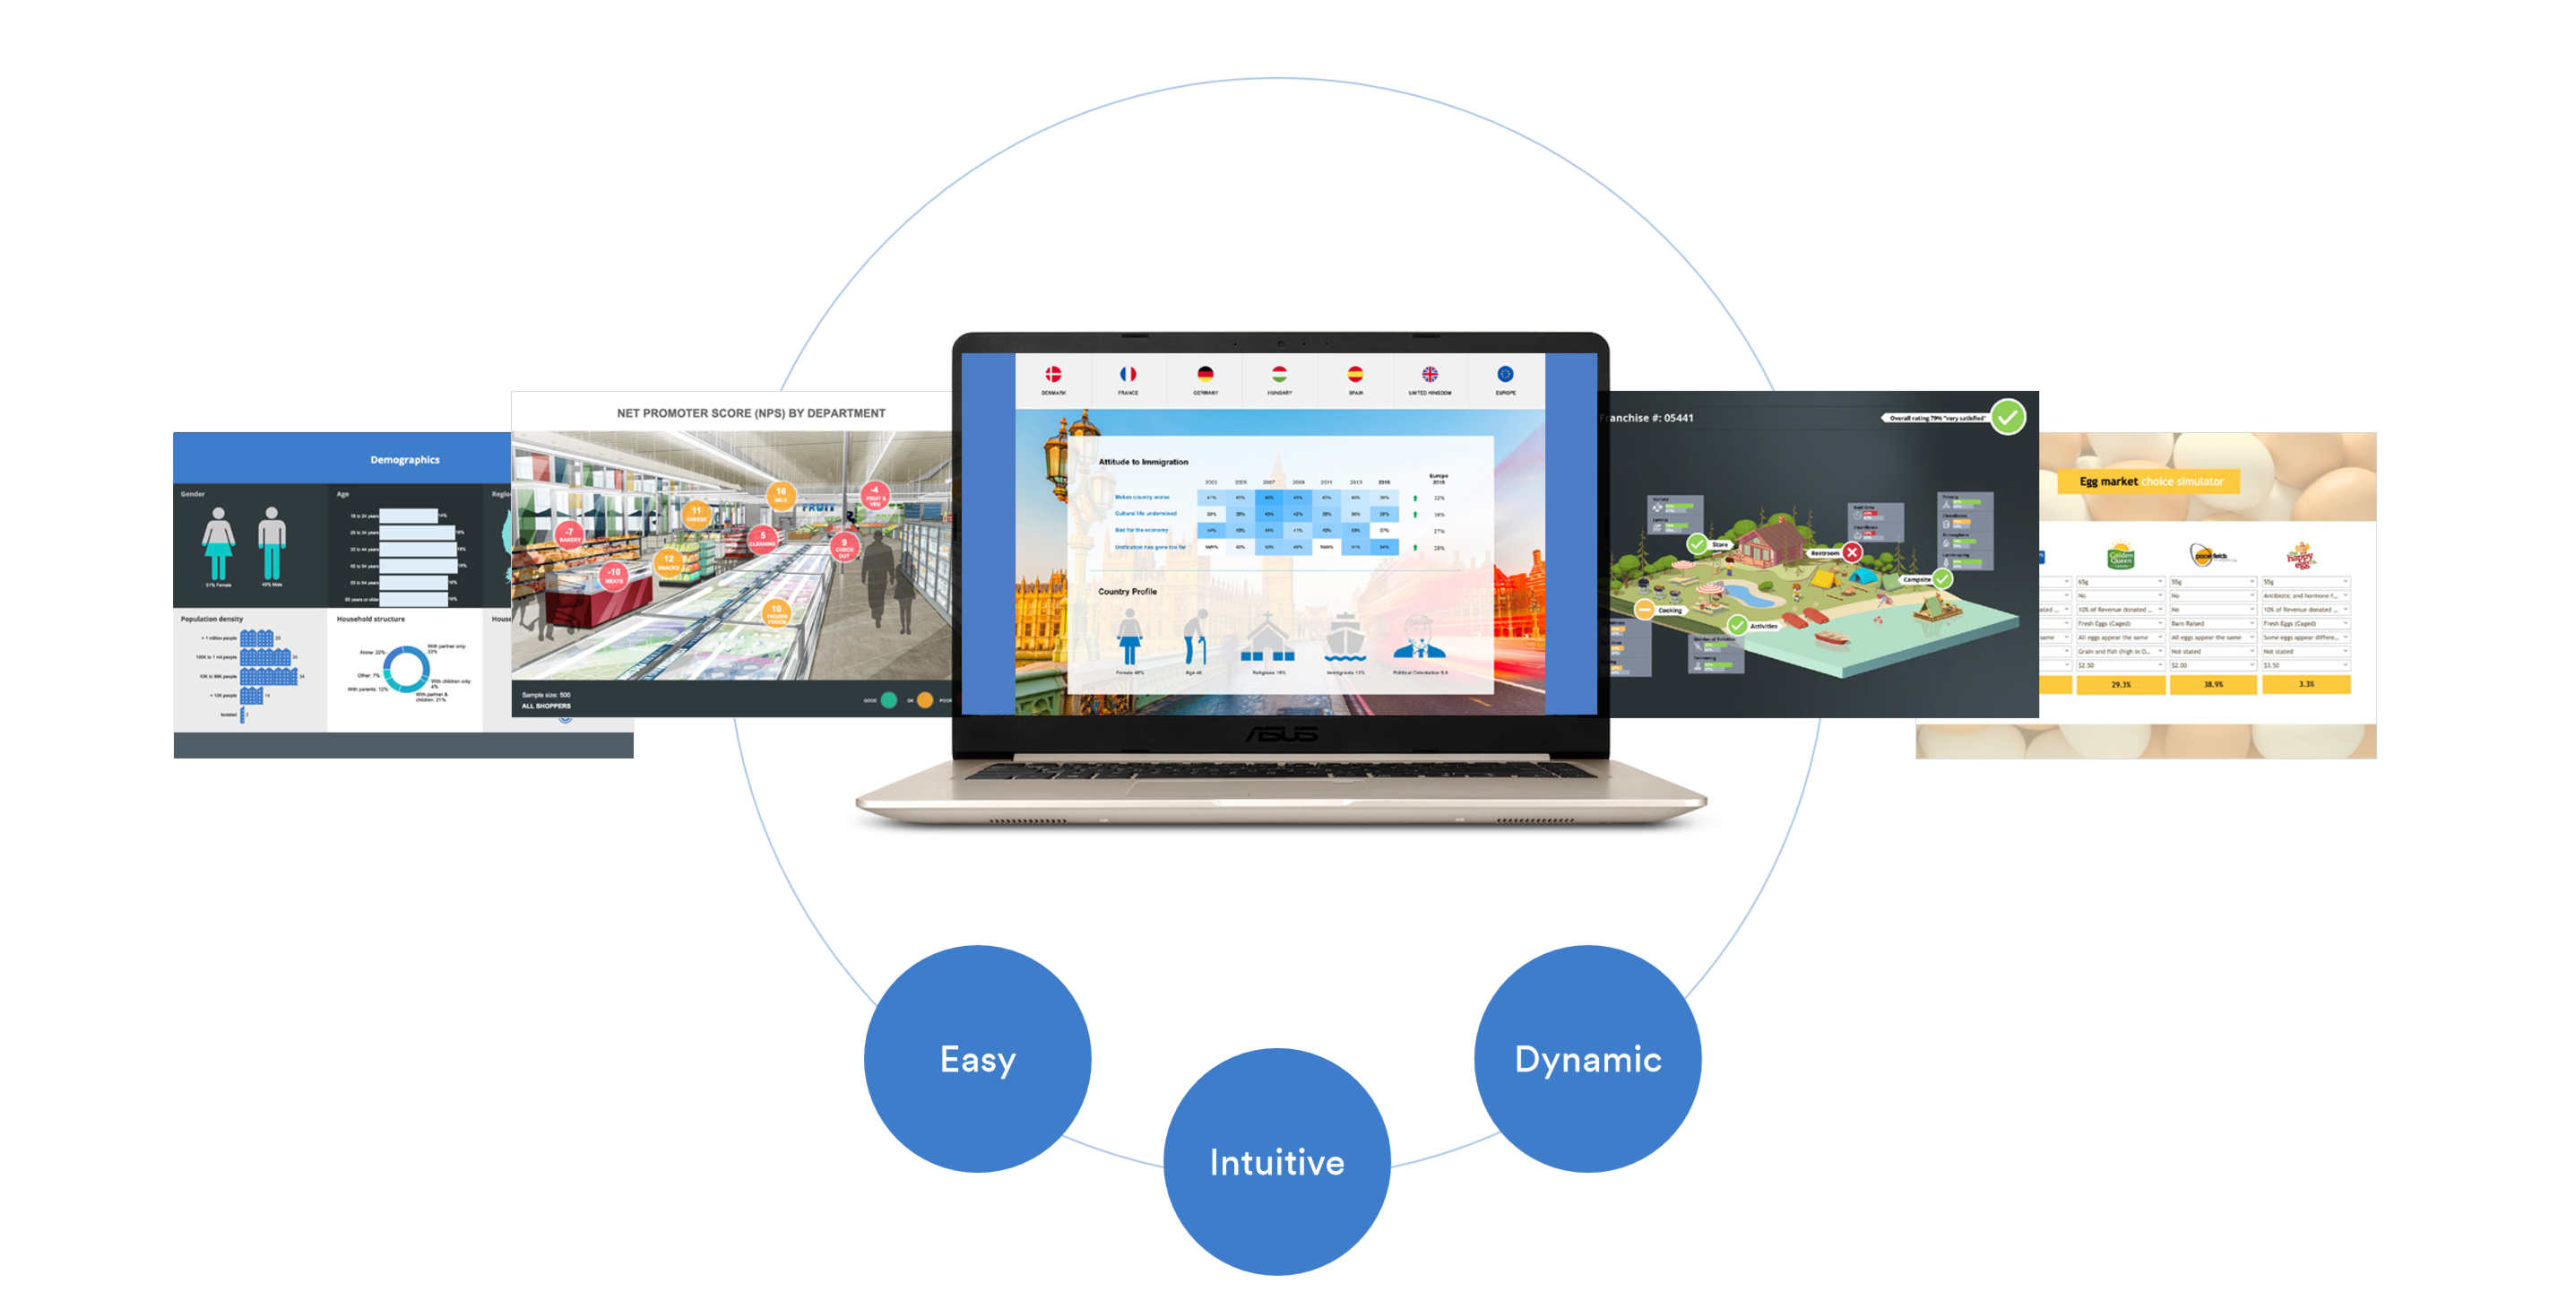
Publish and export beautiful reports. Displayr has a library of visualizations built for online reporting. Use interactive charts and filters. Hide text with hovers and make the meaning in the data instantly recognisable. Displayr also allows you to easily extract and share data in the four standard formats: Excel, PowerPoint, PDF, and as web pages.
So say goodbye to relying on others, and hello to fast DIY questionnaire and survey analysis. Go from data to insight, to sharing beautiful interactive reports and dashboards in half the time it takes you now. Discover how Displayr can help you with your questionnaire analysis. Book a personalized demo.
