


What Is Market Research Analysis Software?
There are many different stages in the process of market research. Some six steps, others say nine. But regardless of how you split it up, the two main things researchers focus on are the collection of samples and the analysis of this data. Market research analysis software, therefore, is any tool that assists with the process of turning data that has been collected as part of a project into insights.
These typically leverage advanced analytics, intuitive visualizations, and automated reporting. Whether you’re a market researcher, consumer insights professional, or business leader, choosing the right software can dramatically improve the speed, accuracy, and impact of your research.
With so many options available, finding the best market research analysis software can be overwhelming. That’s why we’ve compiled this comprehensive list of the top tools in 2026. From all-in-one platforms like Displayr to specialized solutions like SPSS and Tableau, this guide will help you identify the perfect software to elevate your market research and deliver insights that drive success.
Market Observations Software vs. Market Research Software
While market research software focuses on structured data collection and analysis (typically from surveys), market observation software captures unstructured or behavioral data from real-world sources. The difference lies in what is being measured and how it’s collected.
Market research software, as a broader terms, helps researchers design surveys, collect responses, analyze structured data, and generate insights through statistical techniques and dashboards.
In contrast, market observation software is passive and reactive; it observes behavior as it occurs. These tools monitor various aspects, including social media activity, in-store movement, purchase behavior, online reviews, and even facial expressions and foot traffic patterns. They’re ideal for spotting trends, understanding context, and validating what people actually do (not just what they say).
Displayr actually falls under both categories. Although you can not design surveys with Displayr, the tool is purpose-made to analyze survey data. Additionally, these same analysis capabilities work well for the ‘market observation’ data that helps contextualize survey results.
How to Choose the Right Market Research Tools
Selecting the right market research tools starts with your workflow, not a feature list. These six criteria separate tools that fit a research team from tools that merely demo well.
1. Data sources: will it connect to where your data already lives?
The first question isn’t “what can it do” but “will it take my data at all.” Look for native connections to your survey platform (Qualtrics, SurveyMonkey, Decipher, Forsta), the file formats researchers actually receive (SPSS .sav, Excel, CSV), and databases if you run trackers. If a tool requires you to manually reformat files on every project it will not be worth it.
2. Statistical depth: the methods your studies require
Generic BI tools chart data; they don’t run research statistics. Check for what your work actually needs: significance testing, weighting, crosstabs and banners, and the advanced methods your studies use (MaxDiff, conjoint, driver analysis, segmentation). If a tool makes you export to SPSS or R to do the real analysis it’s not analysis software.
3. Reporting and dashboards (whether they update themselves)
Reporting is where research teams lose the most hours. The question that separates tools: when new data arrives does the report rebuild itself, or do you? Look for automated PowerPoint and dashboard output that stays linked to the data, so a tracker’s tenth wave takes minutes, not the days the first one did.
4. Skill required: who on your team can actually use it?
Be honest about who’ll operate it day to day. Code-based tools (R, Python, SPSS syntax) are powerful but gate the work behind one or two specialists, which presents a risk when they’re on leave or leave the company. No-code tools spread the work across the team. The right answer depends on your team; the cost of the wrong one is a bottleneck you won’t see until deadline week.
5. Collaboration and client delivery (how the output gets shared)
If you deliver to stakeholders or clients, check how sharing works before you buy. Can a colleague or client view a dashboard without their own paid seat and login? Can you hand off an interactive report, not just a static file? For agencies especially, this is often the deciding factor, and the one buyers forget to test until after they’ve signed.
6. AI and whether you can trust what it produces
Almost every tool now claims “AI.” The criterion that matters is not whether it has AI, but whether the AI’s output is auditable. Can you trace an AI-generated table or summary back to the underlying data and method? Can you see which model was used and what it did and didn’t touch? A chatbot bolted onto a dashboard that produces numbers you can’t verify is a liability in front of a stakeholder. AI should make defensible analysis faster — not replace your judgment with a black box.
By weighing these factors, you can select a market research analysis tool that fits your organization’s unique requirements and maximizes the value of your insights
Top Online Market Research Tools in 2026
The online market research platforms below are grouped by what they do best – analysis, collection, dashboards, and AI – because no single tool leads in every category. In terms of defining the best market research software, this depends on what you need it for — analysis and reporting, data collection, statistical testing, dashboards, social listening, or consumer insights. Here are the leading tools in each category.
Best for survey analysis & reporting
Displayr
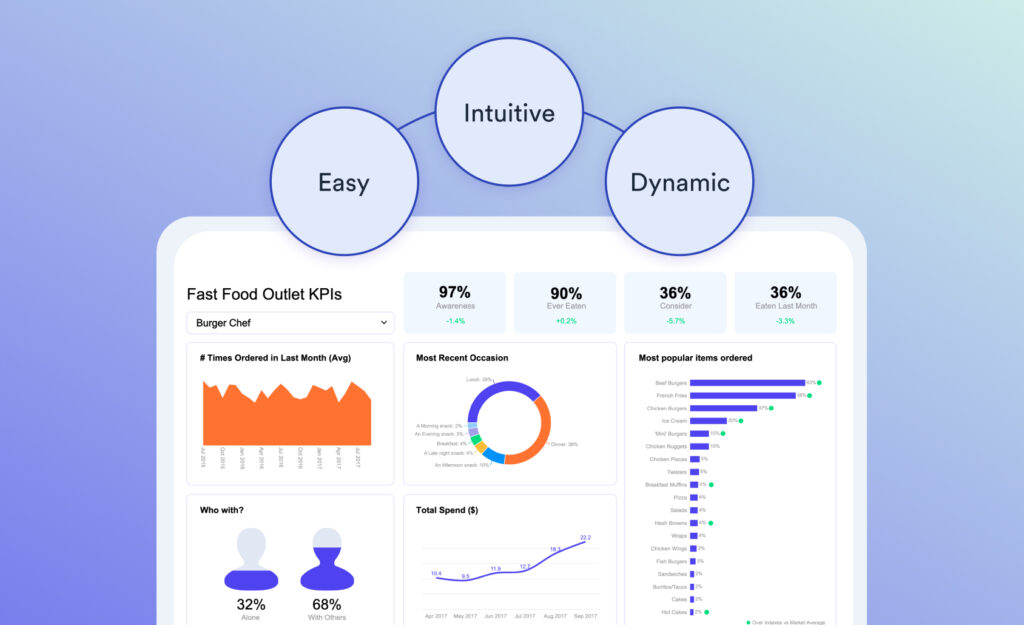
Displayr is market research software built for everything that happens after data collection. Think analysis, dashboards, and reports – all powered by AI.
- Simplified workflow: There’s no need to write code or learn complicated processes. Drag-and-drop makes it easy for beginners to analyze surveys in half the time it takes experts in other statistics and BI tools.
- Automated statistical testing: Easily calculate anything from differences between columns through to deep learning, driver analysis, conjoint, and MaxDiff.
- AI-powered text analysis: Advanced AI and NLP for text analysis and verbatim coding
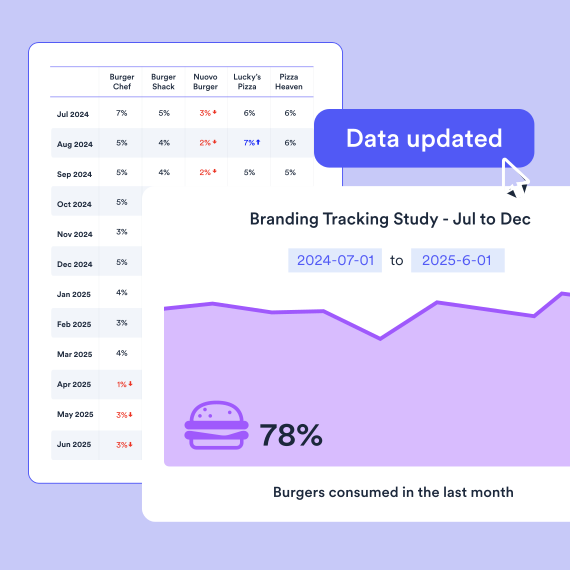
- Automated reporting: Change your input data, and all tables, charts, calculations, and entire reports will automatically update.
- Seamless duplication of work: There’s no need to create new work from scratch; just duplicate and change any existing analysis, visualization, or dashboard.
- Collaborate in the cloud: 10x your team’s productivity with many users working on the same project at the same time.
- Easy to get data in and out: Integrate data with the click of a button. Import data from SPSS, Qualtrics, SQL, URL, Excel, and more. Export as webpages, PowerPoint, Excel, PDF, and embeds.
Q Research Software
Q is a desktop application built specifically for survey data analysis, from Displayr’s own team. It’s known for fast, powerful crosstabs and automated significance testing, and shares much of its analytical engine with Displayr. The trade-off is environment: Q runs on Windows as a desktop tool, so it’s best for analysts who prefer working locally and don’t need Displayr’s cloud collaboration, live dashboards, or web-based reporting.
QuestionPro
QuestionPro is a research suite that pairs survey creation with analysis dashboards and reporting. It’s a capable all-rounder with a generous feature set and a free tier, making it popular with smaller teams. Its analysis depth is lighter than dedicated analysis tools, so it suits straightforward studies more than complex, methods-heavy research.
Best for survey data collection
Platforms focused on designing surveys and gathering responses.
Qualtrics
Qualtrics is a leading experience-management platform that excels at survey creation, distribution, and reaching respondents across channels. For collection and enterprise CX programs, it’s hard to beat. Its analysis and reporting features are less flexible than dedicated analysis tools, so many teams collect in Qualtrics and then export to a tool like Displayr for crosstabs, significance testing, and automated reporting. It also sits at the premium end on price.
SurveyMonkey
SurveyMonkey is one of the most widely used survey tools, with an easy builder and a large library of templates and question types. It’s a strong choice for quick surveys, employee feedback, and straightforward reporting. For serious market research, its analysis is relatively light — advanced statistics, weighting, and automated reporting are limited — so it’s often paired with a dedicated analysis platform.
Typeform
Typeform turns questionnaires into conversational, one-question-at-a-time experiences with strong design and conditional logic. It’s excellent for engaging, on-brand data collection and higher completion rates. Analysis is basic, so it’s best thought of as a collection tool rather than an analysis platform.
SurveySparrow
SurveySparrow offers conversational surveys with automation, recurring sends, and feedback workflows. It’s popular for CX, NPS, and ongoing feedback programs. Like other collection-first tools, its analytical depth is limited for complex market research.
For a deeper comparison of the collection platforms themselves – panels, data quality, synthetic respondents – see our guide to the best survey software for market research.
Best for statistical analysis
Tools for deep statistical work, favored in academia and advanced research.
SPSS
IBM SPSS is a comprehensive statistical package trusted across academia and the social sciences, covering everything from basic crosstabs to advanced multivariate methods. Its depth is undeniable, but it comes with a steep learning curve, relies on syntax for advanced work, and offers little built-in visualization, dashboarding, or automated reporting. For routine survey analysis and client-ready output, it’s powerful but slow compared with purpose-built tools.
R
R is an open-source programming language that is extremely powerful and endlessly extensible, with a vast library of statistical packages — and it’s free. The catch is that it requires real coding expertise and isn’t user-friendly for typical market researchers. It’s best suited to technical analysts who need full control and custom methods.
Best for crosstabs
Specialist tabulation tools for cross-tabulating survey results.
WinCross
WinCross is a long-established tabulation tool used by many traditional tab houses, with robust crosstabs and statistical testing. It’s capable and dependable for high-volume tabulation. However, it requires technical knowledge and has a dated interface, making it less approachable for everyday users than modern, visual tools.
MarketSight
MarketSight is a web-based tool for crosstabs and basic dashboards, accessible to research teams without specialist training. It handles standard survey analysis well. It lacks the depth, automation, and collaborative reporting of platforms like Displayr.
Best for dashboards & data visualization
Business intelligence platforms for interactive dashboards and visual reporting.
Tableau
Tableau is a leading business intelligence and visualization platform, with powerful interactive dashboards and broad data connectivity. It shines for general BI and operational reporting. It isn’t purpose-built for survey data, though — there’s no native weighting or significance testing, and it has a meaningful learning curve — so it fits company-wide BI better than the specifics of market research analysis.
Power BI
Microsoft Power BI is a strong, affordable BI and dashboarding tool with excellent Excel and Office integration. It’s a great fit for general business reporting. Like Tableau, it isn’t designed around survey data structures, so weighting and significance testing aren’t native.
Best AI-powered market research tools
Platforms using AI to automate study design, analysis, and insights.
Quantilope
Quantilope is an AI-driven consumer research platform that automates advanced quantitative methods like conjoint, MaxDiff, and brand tracking through guided workflows. It’s a good fit for teams that want automated study design and faster turnaround on standardized research. It’s more of an end-to-end consumer-insights suite than a flexible analysis environment, so it suits repeatable studies more than bespoke analysis of your own data.
Attest
Attest is a consumer research platform with a built-in global panel and AI-assisted analysis, aimed at fast, rapid-turnaround research. It’s well suited to brand and consumer studies where speed and respondent access matter. It’s built around its own panel, so it’s less about analyzing data you already have.
Best for consumer insights & panels
Data providers offering audience, panel, and consumer trend data.
GWI
GWI is a global consumer research platform offering on-demand audience insights across dozens of markets. It’s strong for audience profiling, segmentation, and trend data. You’re subscribing to GWI’s dataset rather than analyzing your own survey data, so it complements an analysis tool rather than replacing one.
NielsenIQ
NielsenIQ is an established provider of retail measurement and consumer panel data, and a standard in FMCG and CPG. It’s widely used for market share, brand tracking, and category analysis. It’s a data and measurement service rather than a DIY analysis platform.
YouGov
YouGov provides polling and audience profiling drawn from a large, continuously surveyed panel. It’s valuable for brand tracking, public opinion, and audience data. As with other panel providers, the strength is the data itself rather than analysis flexibility.
Best for social listening & brand monitoring
Tools that track brand and topic conversations across social and the web.
Brandwatch
Brandwatch is a social listening and consumer intelligence suite that monitors brand and topic conversations across social channels, with sentiment and trend analysis. It’s strong for understanding the unprompted conversation around a brand or category. It addresses a different need than survey analysis — listening rather than structured research.
Sprinklr
Sprinklr is an enterprise platform combining social listening, customer engagement, and service in one system. It’s built for large organizations managing many channels at scale. It’s broad and enterprise-priced, covering far more than market research alone.
BuzzSumo
BuzzSumo is a content and trend research tool for tracking what’s being shared and discussed across the web, plus influencer identification. It’s useful for content strategy and spotting emerging topics. It’s a complement to research rather than an analysis platform.
Best for secondary & free research
Free and subscription sources for desk research and benchmarking.
Statista
Statista is a large repository of market data, statistics, and industry reports spanning many industries and countries. It’s excellent for secondary research, benchmarking, and quickly sourcing market figures. It provides existing data rather than tools to analyze your own.
Google Trends
Google Trends is a free tool for tracking the relative popularity of search queries over time and by region. It’s a quick, reliable way to spot trends, seasonality, and shifting interest. It’s a starting point for exploratory research rather than a full analysis tool.
Answer the Public
Answer the Public visualizes the questions and phrases people search around a topic, drawn from search data. It’s handy for understanding audience intent and generating content and research ideas. Like Google Trends, it’s an input to research rather than an analysis platform.
The best market research software depends on what you need it for — analysis and reporting, data collection, statistical testing, dashboards, social listening, or consumer insights. Here are the leading tools in each category.
How AI Is Changing Market Research Analysis Tools
The rise of generative AI is changing the entire market research landscape, but this is particularly the case when it comes to market research analysis tools. AI-powered platforms now automate complex tasks that once required hours of manual work, enabling researchers to process vast datasets, uncover patterns, and generate actionable insights in real time. Some of the most powerful use cases include:
- Advanced text and sentiment analysis: AI’s natural language processing capabilities enable market research tools to extract meaning from open-ended survey responses, social media posts, and customer feedback at scale. This allows for a deeper understanding of consumer sentiment and the ability to track brand perception across multiple channels in real time.
- Real-time data processing and predictive analytics: Modern AI-driven tools excel at processing live data streams, allowing businesses to react instantly to market shifts, customer behavior changes, or competitor moves. Predictive analytics powered by machine learning helps forecast trends, identify emerging opportunities, and anticipate consumer needs—capabilities that were previously out of reach for most organizations.
- Streamlining tasks: AI tools can automatically analyze both quantitative and qualitative data, produce interactive dashboards with minimal user intervention, and even help with interpreting results. This automation dramatically reduces the time from data collection to insight, freeing up researchers to focus on strategy and interpretation rather than repetitive processes.
Market Research Software FAQs
Is Displayr the best market research software?
Displayr is purpose-built for market researchers—not a generic analytics tool. It includes all the statistical methods researchers use daily (crosstabs, significance testing, MaxDiff, driver analysis, segmentation) plus automated reporting and interactive dashboards. If you’re analyzing survey data, it’s specifically designed for you.
What should I look for in market research software?
The best market research software should handle your data sources (Qualtrics, SPSS, Excel, etc.), support statistical analysis without coding, enable fast reporting, and scale with your team. Look for tools that understand researcher workflows rather than forcing you to adapt to a generic platform.
How does Displayr compare to other market research software?
Most “market research software” is either expensive enterprise BI tools or generic analytics platforms. Displayr is different—it’s built specifically for survey and research data. You get statistical methods built-in, no SQL required, live dashboards, and automated reporting. Plus, you can publish interactive dashboards and reports in minutes, not weeks.
Can I switch from SPSS or other tools to Displayr?
Yes. Displayr imports SPSS files, Excel data, Qualtrics surveys, and SQL databases directly. You get the same statistical capabilities as SPSS but with faster workflows, better visualizations, and automated reporting—plus a modern interface without the steep learning curve.
Want to find more use cases for AI in market research? Download Displayr’s 5 Ways to Use AI in Market Research Today whitepaper.