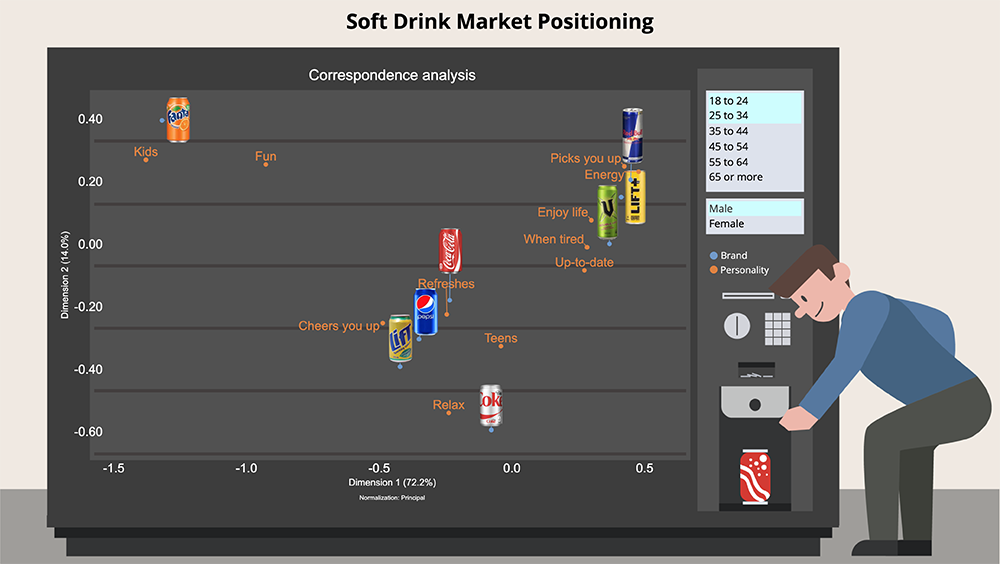
Welcome to our Interactive Brand Positioning Map – the ultimate tool for understanding the competitive landscape of your product. With this fun and interactive visualization, you can easily explore the positioning of different soft drink brands and their unique attributes.
Powered by correspondence analysis in Displayr, our map is both informative and easy to use. You can turn filters on and off by selecting age and gender groups and even drag the soft drink cans and statements around the map to make them easier to read. With real-time updates when you have new data and interactive features, you’ll be able to immerse yourself in the world of soft drinks and discover new insights about your favorite brands.
This map is designed to help you understand what makes each brand unique. For example, the top-right corner of the map shows all the highly caffeinated energy drinks, clustered together and owning energy-related attributes. Fanta appears in the top-left corner, representing the brand’s focus on fun and appeal to kids. Meanwhile, Coke, Pepsi, and Lift sit near the middle of the map, indicating that they may not be as differentiated as other brands.
So whether you’re a marketer looking to understand the competitive landscape or a market researcher interested in discovering new ways to report and share data, start exploring the Interactive Brand Positioning Map template and learn how to easily share insights like never before!
TRUSTED BY THOUSANDS OF CUSTOMERS


VP Data & Analytics, Cygnal
More examples
Interactive
Interactive
Interactive
Interactive

