

Survey data isn’t always perfect. In fact, it is almost impossible to collect data from a sample of individuals that 100% accurately represents the known demographic characteristics of the target population (age, gender, income, etc).
Weighting survey data is how researchers get around this issue. It’s all about ensuring your results align more closely with known facts. By using various data weighting techniques, such as post-stratification, you can correct for imbalances and improve data reliability..
This blog is your guide to survey data weighting techniques. We’ll explain some of the main methods of weighting data, when to use each one, and how you can use these techniques to produce more accurate findings.
How Weighting Data Works
Before we examine the specific techniques, it’s worth explaining how weighting data works. Put simply, a ‘weight’ is assigned to each sample unit, based on its relative importance in representing the broader population.
For example, if your survey respondents are only 40% female, but you know the actual population is 50% female, you would assign a higher weight to each female respondent to bring their representation closer to 50%. For this example, calculating the weight factor is as simple as dividing the target population percentage (50%) by the sample percentage (40%), which equals 1.25.
Unfortunately, most studies deal with multiple variables, which can make weighting far more complex.

Why Do We Weight Survey Data?
There’s no doubt weighting adds time and complexity to a study. So why do we bother? Well, it gets to the fundamentals of what market research is.
As a researcher, you aim to draw insights about an entire population. Of course, you can’t interview the entire population, so you instead speak to a small selection of this population – the sample. This sample should be representative of the population. However, factors like sampling bias or selective non-response mean our samples rarely indicate the population.
If conducting a survey on the opinions of registered voters in a city, we want our results to reflect the views of all registered voters, not just the specific individuals who happened to respond to the survey. Weighting is how we bridge that gap, ensuring our sample data more accurately mirrors the population as a whole.
When To Weight Survey Data
There are three main scenarios to look out for when weighting your data.
- If there are discrepancies between the survey results and known facts (e.g., official census data indicates 15% of the population are aged 65 and older, but your survey shows only 8% in that age group).
- If the discrepancy is because you’ve over- or under-sampled specific demographic groups. For instance, if your survey shows 30% of respondents are from a specific region, but census data reveals that region only comprises 20% of the population, it indicates oversampling.
- If the discrepancies are significant enough to cause the study results to be wrong. For example, a survey that aims to gauge public sentiment on a new national policy, but has drastically underrepresented rural populations, where the support of the policy is known to be significantly lower.
Ideally, all three of these conditions should be in place for you to go ahead with weighting your survey data. However, many will weight data if just the first two scenarios are in place, mostly because it can be challenging to prove discrepancies are significant enough for results to be wrong.
Best Survey Weighting Methods
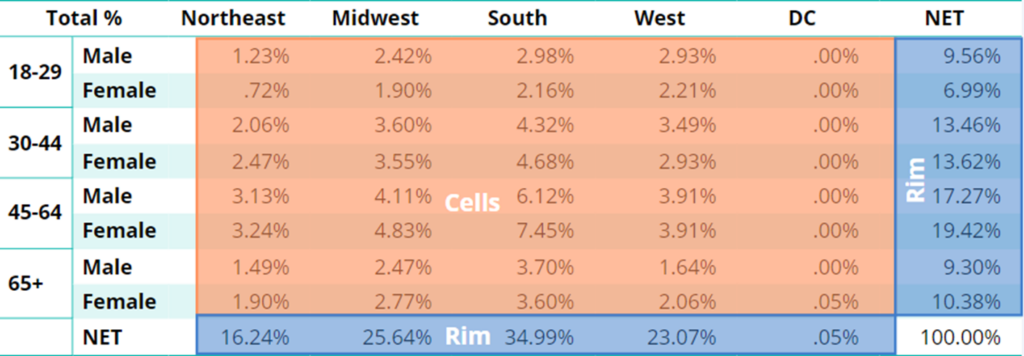
Note: Cell and rim weighting rely on tabular data. Think of a table: the “cells” are on the inside, and the “rims” are the summary totals along the table’s perimeter. See image below.
1. Cell Weighting
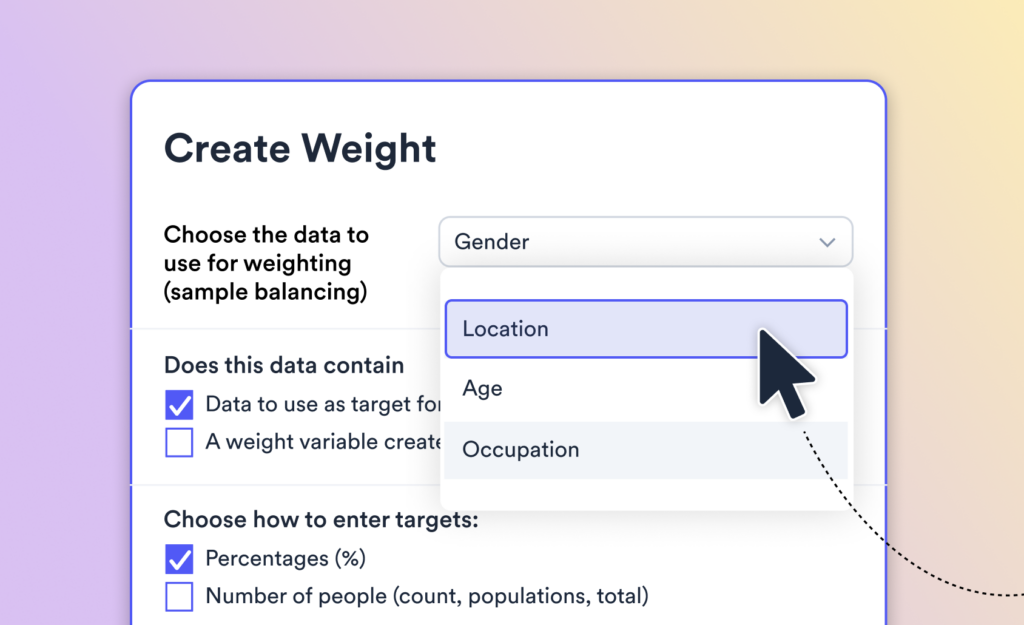
Cell weighting assigns weights to specific groups within a table, where each ‘cell’ represents a unique combination of categories (e.g., age and gender together). It is commonly used when you have accurate population data for these combined groups and need to adjust your sample accordingly.
The reason for its popularity is its simplicity. A cell weight can be created using just one variable. If a cell is underrepresented in your survey, you assign higher weights to those respondents, and vice versa. This straightforward approach allows for precise adjustments, ensuring each category accurately reflects its proportion in the overall population.
The caveat with cell weighting is that you must know the interlocked targets, meaning you need to have accurate population data for each specific combination of categories within your variable. If you’re weighting by both age and gender together, you need to know the exact population percentages for each age-gender combination (e.g., 18-24 males, 18-24 females, etc.)
2. Rim Weighting (Raking)
Rim weighting (also called raking) provides more flexibility than cell weighting. Cell weighting can be done with just one variable, whereas rim weighting can be done with multiple adjustment variables. As mentioned above, rim weighting takes the summary totals on a table, meaning you only need population data for the individual variables – not the combined intersections.
By adjusting weights iteratively across multiple variables (i.e., age and gender separately), rim weighting ensures the sample aligns with the population distribution, even when interlocked targets are unavailable. For example, you might know that 52% of the population is female and 30% is aged 18-34, but you might not have data on the exact percentage of 18-34-year-old females. Rim weighting allows you to adjust the weights to match the 52% female and 30% 18-34 targets independently, even without knowing the combined percentage.
Because rim weighting does not account for how variables interact, it may not perfectly match all subgroup distributions, leading to less precise adjustments than cell weighting in some cases.
3. Weight Calibration
Weight calibration is a technique used when your analysis software cannot directly handle sampling weights, but can process frequency weights. It involves scaling the sampling weights so they can be treated as frequency weights, enabling analysis in software with limited weighting capabilities.
To perform weight calibration, the sampling weights are adjusted to have an average equal to the effective sample size divided by the actual sample size (ESS/n). Weight calibration adjusts sampling weights to align with the effective sample size, ensuring more precise estimations. For instance, if a survey has a sample size of 300, an average weight of 1.3, and an effective sample size of 120, each weight is multiplied by 120 / (1.3 * 300). This produces calibrated weights, which are then treated as frequency weights.
While weight calibration is generally preferable to ignoring sampling weights or directly treating them as frequency weights, it is not a perfect method. The effective sample size itself may be calculated with inaccuracies. Additionally, even with a correct effective sample size, the resulting standard errors may differ from those obtained using more sophisticated weighting methods.
Nevertheless, weight calibration offers a practical approach to improve data accuracy when software limitations prevent direct sampling weight usage. Methods like Shapley values and relative weights can alsio provide deeper insights into predictor importance when working with weighted data.
4. Trimming
Weight trimming involves limiting the minimum and maximum values a weight can take. We use this when weighting results in particularly large or small weights, which in turn reduces the effective sample size.
There are several methods for trimming:
- Simple Trimming: This method replaces weights below a set minimum with that minimum value, and weights above a set maximum with that maximum value.
- Constrained Calibration: This uses algorithms that allow you to set both target values and upper/lower weight limits.
- Repeated Raking and Trimming: This involves repeatedly calculating weights using raking or calibration, trimming them, and then recalculating, until the weights stabilize.
Simple trimming is generally not recommended. It can change the average weight from 1 and cause weighted tables to deviate from target values. Constrained calibration and repeated raking and trimming can be more effective, but their success can vary.
Key considerations when trimming weights include:
- The minimum and maximum limits should be inversely related (e.g., if the maximum is 5, the minimum should be around 0.2).
- Adjusting the upper or lower limit can have different impacts on the results.
- Narrowing the weight range typically increases the effective sample size.
- With cell weighting, trimming always increases the difference between the targets and the weighted results, which is not always the case with calibration or raking.
How to Weight Survey Data in R
The survey package is the standard tool for applying weights in R. It lets you define a weighted survey design and then run analyses that properly account for those weights.
library(survey)

# Define the survey design with a weight variable
design <- svydesign(ids = ~1, data = df, weights = ~weight)

# Weighted mean
svymean(~age, design)

# Weighted crosstabulation
svytable(~gender + age_group, design)
The weights argument takes a column from your data frame containing the weight value for each respondent. If you are using rim weighting to calculate weights from population targets, the rake() function automates the iterative adjustment process:
raked <- rake(
  design,
  sample.margins = list(~gender, ~age_group),
  population.margins = list(gender_pop, age_pop)
)
Where gender_pop and age_pop are data frames containing the target population proportions for each variable.
Master Survey Weighting Techniques With Displayr
With so many different methods and techniques, weighting data can be complicated. Displayr gives you everything you need to easily calculate and apply weighting to your data. It’s your way to make your surveys, research, and reports more accurate and representative – without the complexity.
Ready to try it today? Check out our free Weighting Calculator for a hands-on guide.